02Case study · Dashboard
A product analytics overview in one screen.
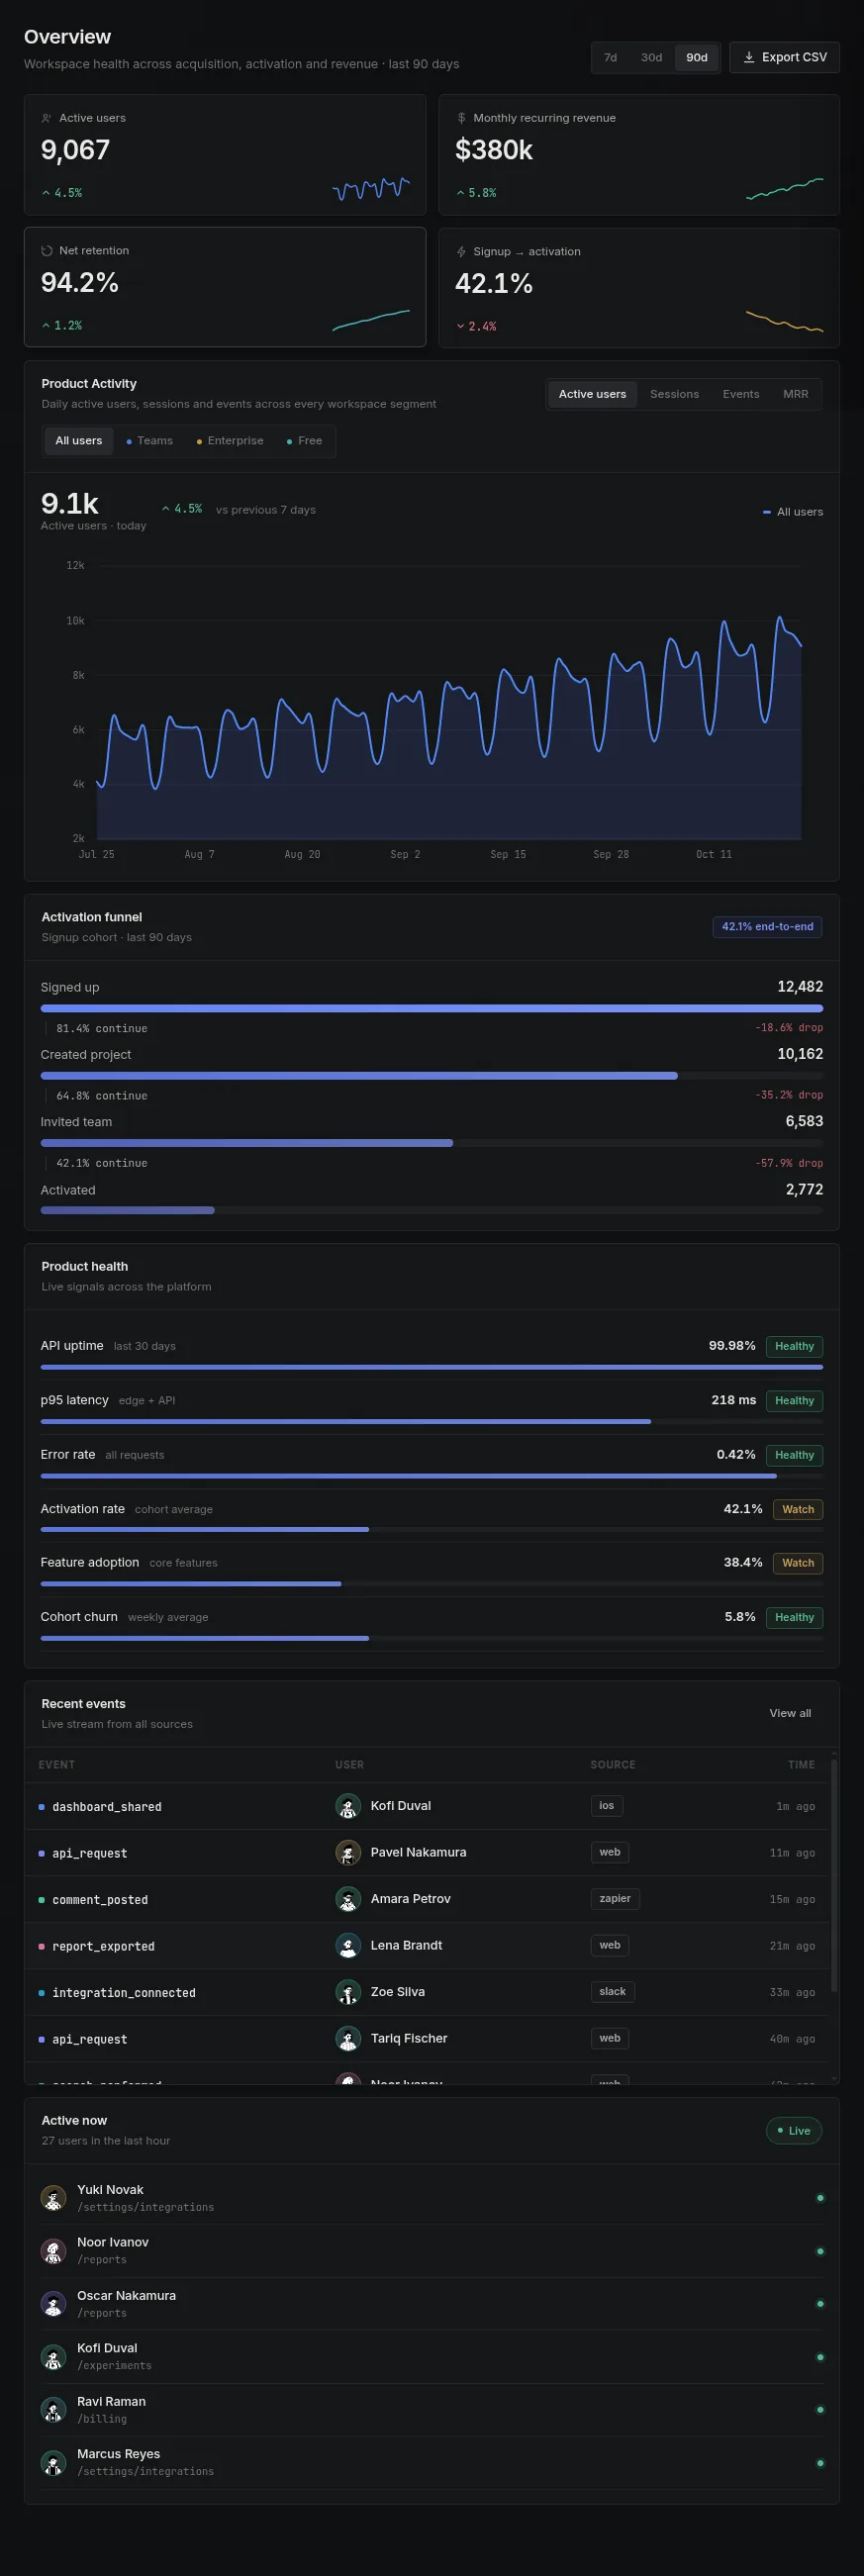
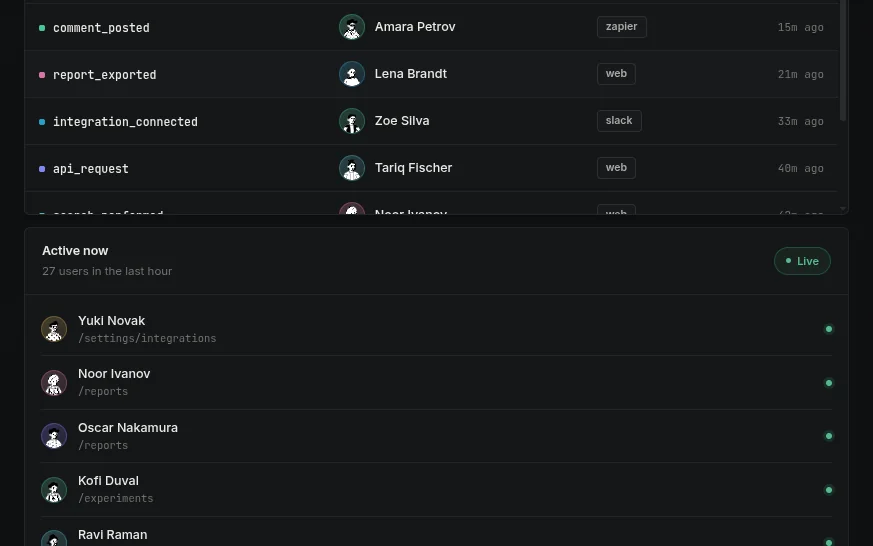
A dark analytics dashboard with KPI cards, a segmented activity chart, an activation funnel and a live event stream.
- Category
- Dashboard
- Role
- Built end to end
Hover to scroll the page · full screenshot below
Overview
What it is
A product analytics dashboard overview. It pairs headline KPIs with a segmented activity chart, an activation funnel, product-health signals and live event activity — designed to make workspace health readable at a glance.
Key features
What's on the page
- KPI cards with sparklines for active users, MRR, net retention and activation
- 7d / 30d / 90d range switcher and CSV export
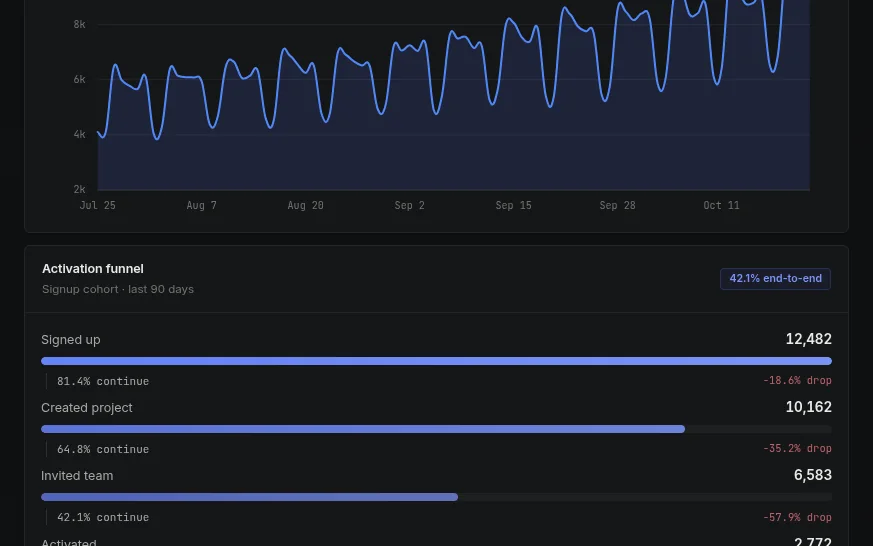
- Activity chart with metric tabs and segment filters
- Activation funnel with step-by-step drop-off
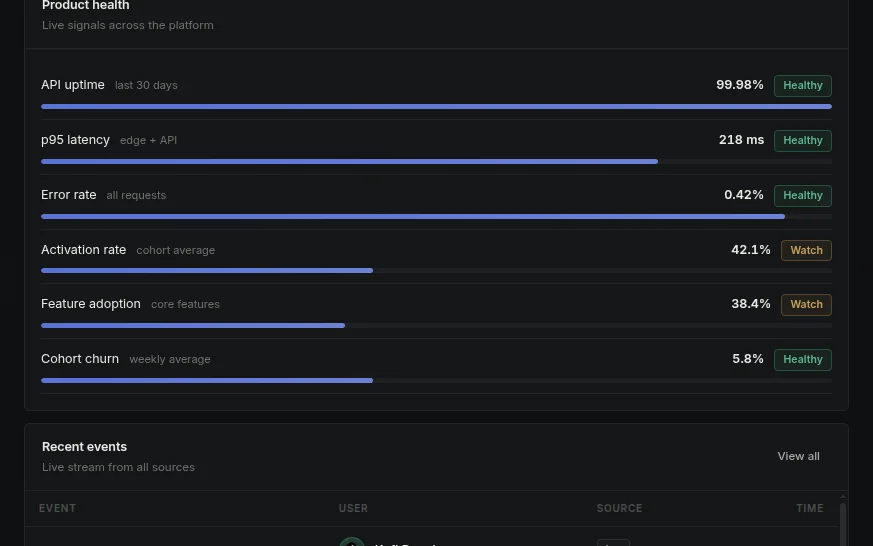
- Product-health panel with status badges
- Recent events table and a live “active now” list
Technologies
Built with
- React
- Tailwind CSS
- Custom CSS
Full-page screenshot
Details
Closer look
StackReactTailwind CSSCustom CSS
Next project
Next project
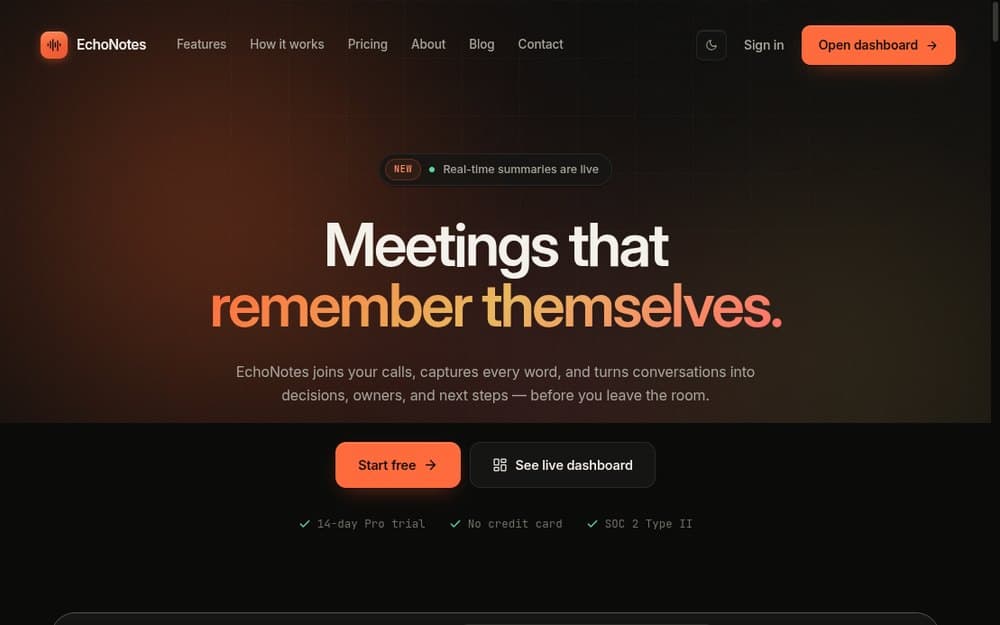
EchoNotesMeetings that remember themselves.